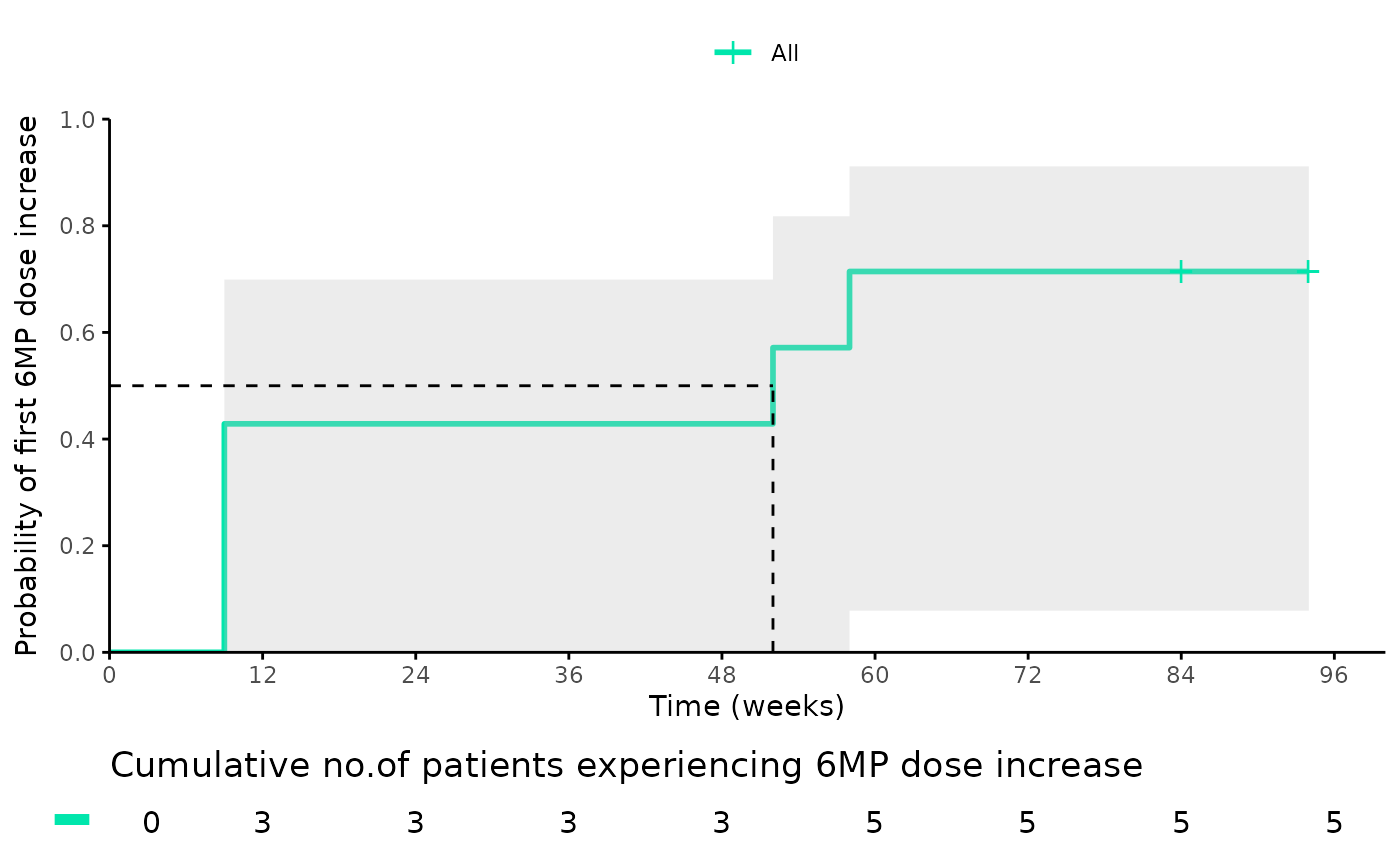
Plot the time taken for FIRST 6-Mercaptopurine (6MP) dose increase in cohort
Source:R/time_to_first_dose_increase.R
time_to_first_dose_increase.RdEvaluate median time (in weeks) to first 6MP dose increase for the cohort using Kaplan-Meier cumulative incidence estimator using ggsurvplot package
Examples
cohort_path = paste0(system.file("extdata/processed_data/", package = "allMT"), "/")
time_to_first_dose_increase(input_files_path = cohort_path,
                escalation_factor = 10)
#> NOTE: Analyzing provided input files
#> Call: survfit(formula = survival::Surv(Weeks, status) ~ 1, data = DoseInc)
#>
#>      n events median 0.95LCL 0.95UCL
#> [1,] 7      5     52       9      NA
#> Ignoring unknown labels:
#> • fill : ""
#> Ignoring unknown labels:
#> • fill : ""
#> Ignoring unknown labels:
#> • fill : ""
#> Ignoring unknown labels:
#> • fill : ""
#> Ignoring unknown labels:
#> • colour : ""

#> Time to dose increase graph created
#> Quitting
#> Bye Bye: Question - Is Pluto a planet? :)
#> Ignoring unknown labels:
#> • fill : ""
#> Ignoring unknown labels:
#> • fill : ""
#> Ignoring unknown labels:
#> • fill : ""
#> Ignoring unknown labels:
#> • colour : ""
#> Time to dose increase graph created
#> Quitting
#> Bye Bye: Question - Is Pluto a planet? :)
#> Ignoring unknown labels:
#> • fill : ""
#> Ignoring unknown labels:
#> • fill : ""
#> Ignoring unknown labels:
#> • fill : ""
#> Ignoring unknown labels:
#> • colour : ""