Plot a cycle-specific summary graph of maintenance therapy (MT) data for single patient
Source:R/summarize_cycle_progression.R
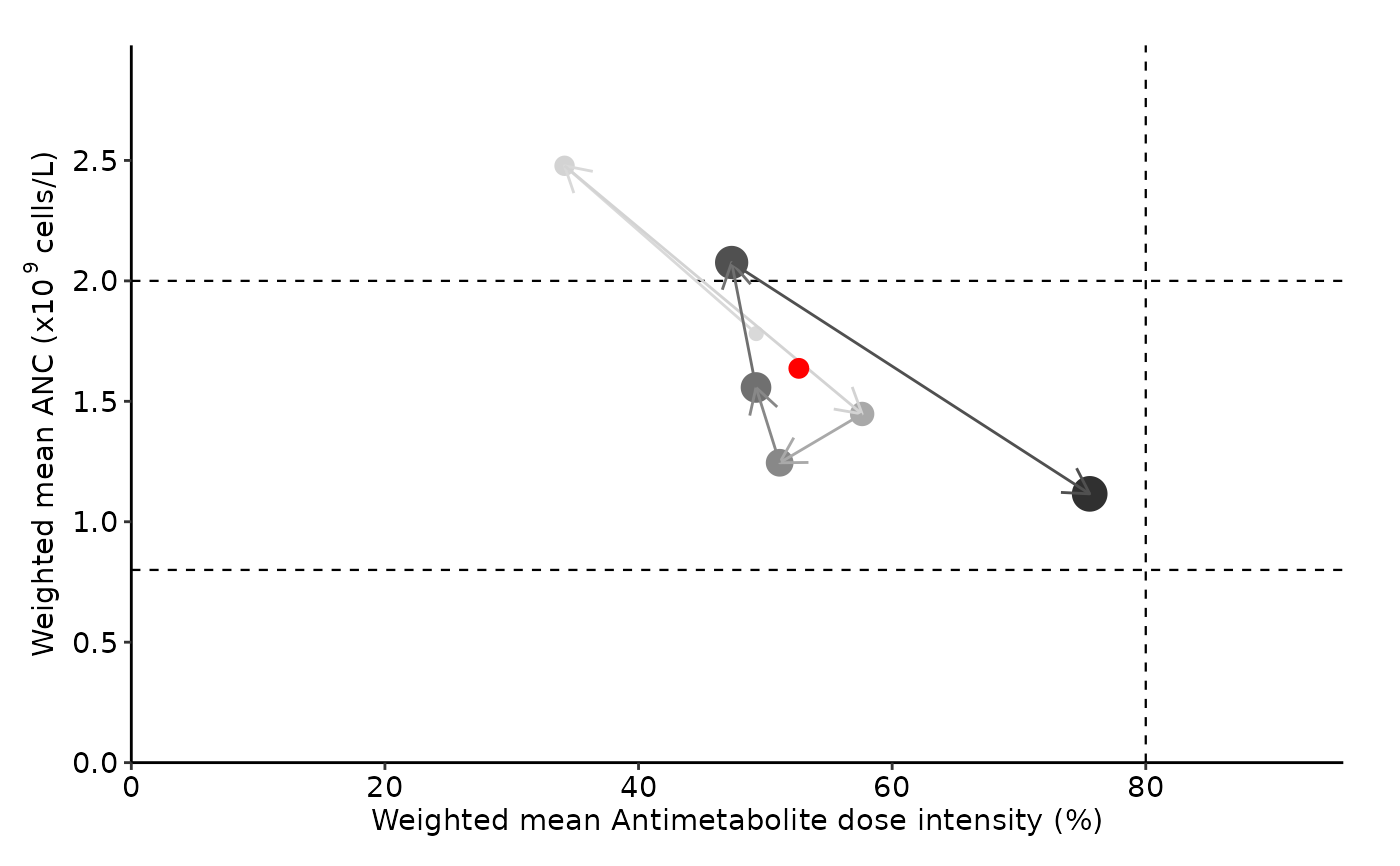
summarize_cycle_progression.RdCreate summary graph with maintenance therapy data. Weighted mean absolute neutrophil count (ANC) and dose information is calculated and plotted for each cycle.
Arguments
- input_file_path
Path to input csv file for the patient (in quotes)
- anc_range
ANC target range as per the protocol: (c(lower threshold, upper threshold)). NOTE: Ensure that units are the same as unit of ANC in the input data.
- unit
Choose either "million" or "billion".
"million" = million cells/L (x\(10^{6}\) cells/L or cells/\(\mu\)l)
"billion" = billion cells/L (x\(10^{9}\) cells/L or x\(10^{3}\) cells/\(\mu\)l)
Note
If there is only one threshold for anc_range parameter, please specify the respective value and keep the other threshold as NA. eg : c(2000, NA)
Horizontal dotted lines on the graph indicate anc_range thresholds.Red dot represents summarized overall MT data.
Examples
pat_data = system.file("extdata/processed_data/", "UPN_916.csv", package = "allMT")
summarize_cycle_progression(input_file_path = pat_data, anc_range = c(0.75, 1.5),
unit = "billion")
#> NOTE: Analyzing provided input file
#> Scale for y is already present.
#> Adding another scale for y, which will replace the existing scale.
#> Cycle progression summary graph created
#> Quitting
#> Bye Bye: Did you know that Saturn is second largest planet in our solar system :)?
#> Warning: Using size for a discrete variable is not advised.
#> Warning: Removed 1 row containing missing values or values outside the scale range
#> (`geom_vline()`).
#> Warning: Removed 1 row containing missing values or values outside the scale range
#> (`geom_point()`).
#> Warning: Removed 1 row containing missing values or values outside the scale range
#> (`geom_path()`).
 # \donttest{
summarize_cycle_progression(input_file_path = pat_data,
anc_range = c(0.8, 2), unit = "billion")
#> NOTE: Analyzing provided input file
#> Scale for y is already present.
#> Adding another scale for y, which will replace the existing scale.
#> Cycle progression summary graph created
#> Quitting
#> Bye Bye: Did you know that Saturn is second largest planet in our solar system :)?
#> Warning: Using size for a discrete variable is not advised.
#> Warning: Removed 1 row containing missing values or values outside the scale range
#> (`geom_vline()`).
#> Warning: Removed 1 row containing missing values or values outside the scale range
#> (`geom_point()`).
#> Warning: Removed 1 row containing missing values or values outside the scale range
#> (`geom_path()`).
# \donttest{
summarize_cycle_progression(input_file_path = pat_data,
anc_range = c(0.8, 2), unit = "billion")
#> NOTE: Analyzing provided input file
#> Scale for y is already present.
#> Adding another scale for y, which will replace the existing scale.
#> Cycle progression summary graph created
#> Quitting
#> Bye Bye: Did you know that Saturn is second largest planet in our solar system :)?
#> Warning: Using size for a discrete variable is not advised.
#> Warning: Removed 1 row containing missing values or values outside the scale range
#> (`geom_vline()`).
#> Warning: Removed 1 row containing missing values or values outside the scale range
#> (`geom_point()`).
#> Warning: Removed 1 row containing missing values or values outside the scale range
#> (`geom_path()`).
 # As per BFM protocol (Reference PMID - 15902295):
summarize_cycle_progression(input_file_path = pat_data,
anc_range = c(2, NA),
unit = "billion")
#> NOTE: Analyzing provided input file
#> Error
#> <simpleError in if (anc_range[1] > 100 | anc_range[2] > 100) { message("Warning: Are you sure the anc_range corresponds to the selected 'unit'?")}: missing value where TRUE/FALSE needed>
#> Quitting
#> Bye Bye: Did you know that Saturn is second largest planet in our solar system :)?
# As per St Jude protocol (Reference PMID - 15902295):
summarize_cycle_progression(input_file_path = pat_data,
anc_range = c(0.8, 2),
unit = "billion")
#> NOTE: Analyzing provided input file
#> Scale for y is already present.
#> Adding another scale for y, which will replace the existing scale.
#> Cycle progression summary graph created
#> Quitting
#> Bye Bye: Did you know that Saturn is second largest planet in our solar system :)?
#> Warning: Using size for a discrete variable is not advised.
#> Warning: Removed 1 row containing missing values or values outside the scale range
#> (`geom_vline()`).
#> Warning: Removed 1 row containing missing values or values outside the scale range
#> (`geom_point()`).
#> Warning: Removed 1 row containing missing values or values outside the scale range
#> (`geom_path()`).
# As per BFM protocol (Reference PMID - 15902295):
summarize_cycle_progression(input_file_path = pat_data,
anc_range = c(2, NA),
unit = "billion")
#> NOTE: Analyzing provided input file
#> Error
#> <simpleError in if (anc_range[1] > 100 | anc_range[2] > 100) { message("Warning: Are you sure the anc_range corresponds to the selected 'unit'?")}: missing value where TRUE/FALSE needed>
#> Quitting
#> Bye Bye: Did you know that Saturn is second largest planet in our solar system :)?
# As per St Jude protocol (Reference PMID - 15902295):
summarize_cycle_progression(input_file_path = pat_data,
anc_range = c(0.8, 2),
unit = "billion")
#> NOTE: Analyzing provided input file
#> Scale for y is already present.
#> Adding another scale for y, which will replace the existing scale.
#> Cycle progression summary graph created
#> Quitting
#> Bye Bye: Did you know that Saturn is second largest planet in our solar system :)?
#> Warning: Using size for a discrete variable is not advised.
#> Warning: Removed 1 row containing missing values or values outside the scale range
#> (`geom_vline()`).
#> Warning: Removed 1 row containing missing values or values outside the scale range
#> (`geom_point()`).
#> Warning: Removed 1 row containing missing values or values outside the scale range
#> (`geom_path()`).
 # }
# }